What is information design and how can it make an impact?
Information design is the practice of presenting information effectively for the purpose of understanding. Emerging in the 1970s as a multidisciplinary field, it now spans graphic design, statistics, and data science. Yet its roots run much deeper. Pioneers like William Playfair, John Snow, Charles Minard, and Edward Tufte have shaped a discipline with a long and prolific history. One that has quite literally changed and saved lives through the clarity it brings to complex information.
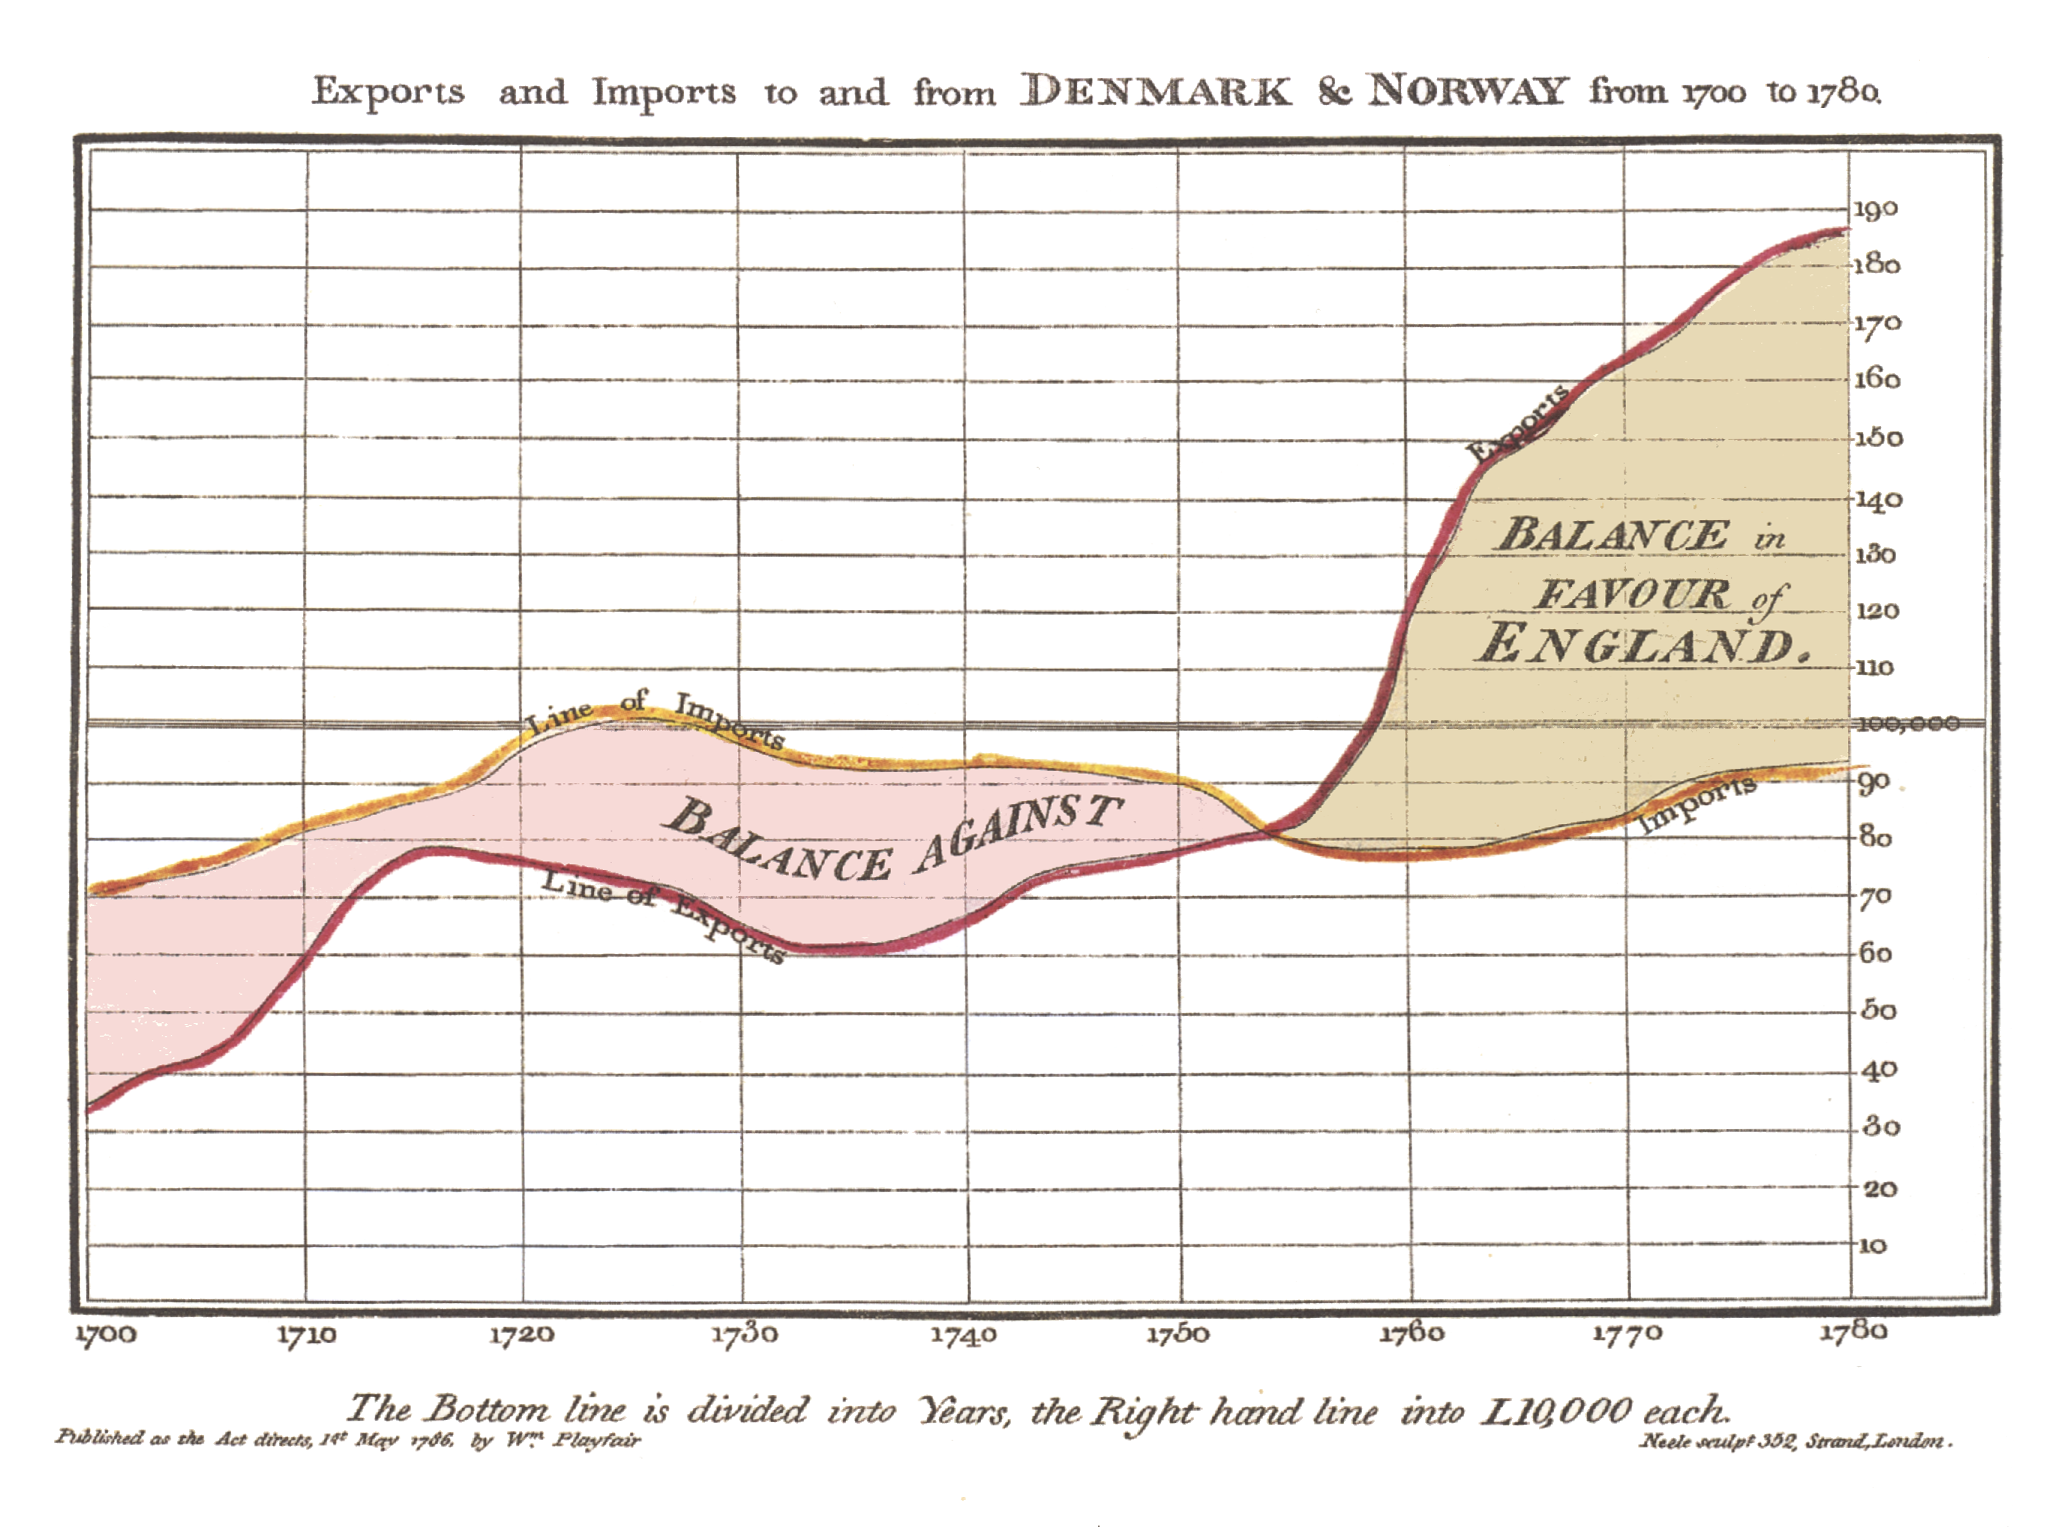 William Playfair’s 1786 line chart showing the balance of trade between England and other nations.
 John Snow’s map showing the clusters of Cholera cases in the London epidemic of 1854.
After the Crimean War (1853-1856), a statistician and pioneer of modern nursing named Florence Nightingale returned home as a hero. She had reduced the mortality rate at a military hospital in Scutari from 40% to 2% through revolutionary views on the importance of sanitation.
With the personal backing of Queen Victoria, Nightingale led a royal commission into the health of the army. The commission’s report, published in 1858, was filled with charts and tables that revealed a startling truth: far more soldiers died from disease than from Russian cannons. Moreover, soldiers living in cramped, unsanitary barracks died at a faster rate than civilians.
To communicate her findings and drive reform, Nightingale employed a range of visual methods—including inventing her own diagram, the ‘Rose Diagram’. In one of her most famous examples, two circles divided into twelve wedges show the number of annual fatalities at Scutari from April 1854 to March 1856. The wedges are colour-coded: blue represents deaths by disease, red shows battle wounds, and black indicates other causes. The two “roses” dramatically illustrate the period before and after the arrival of the sanitary commission in March 1855.
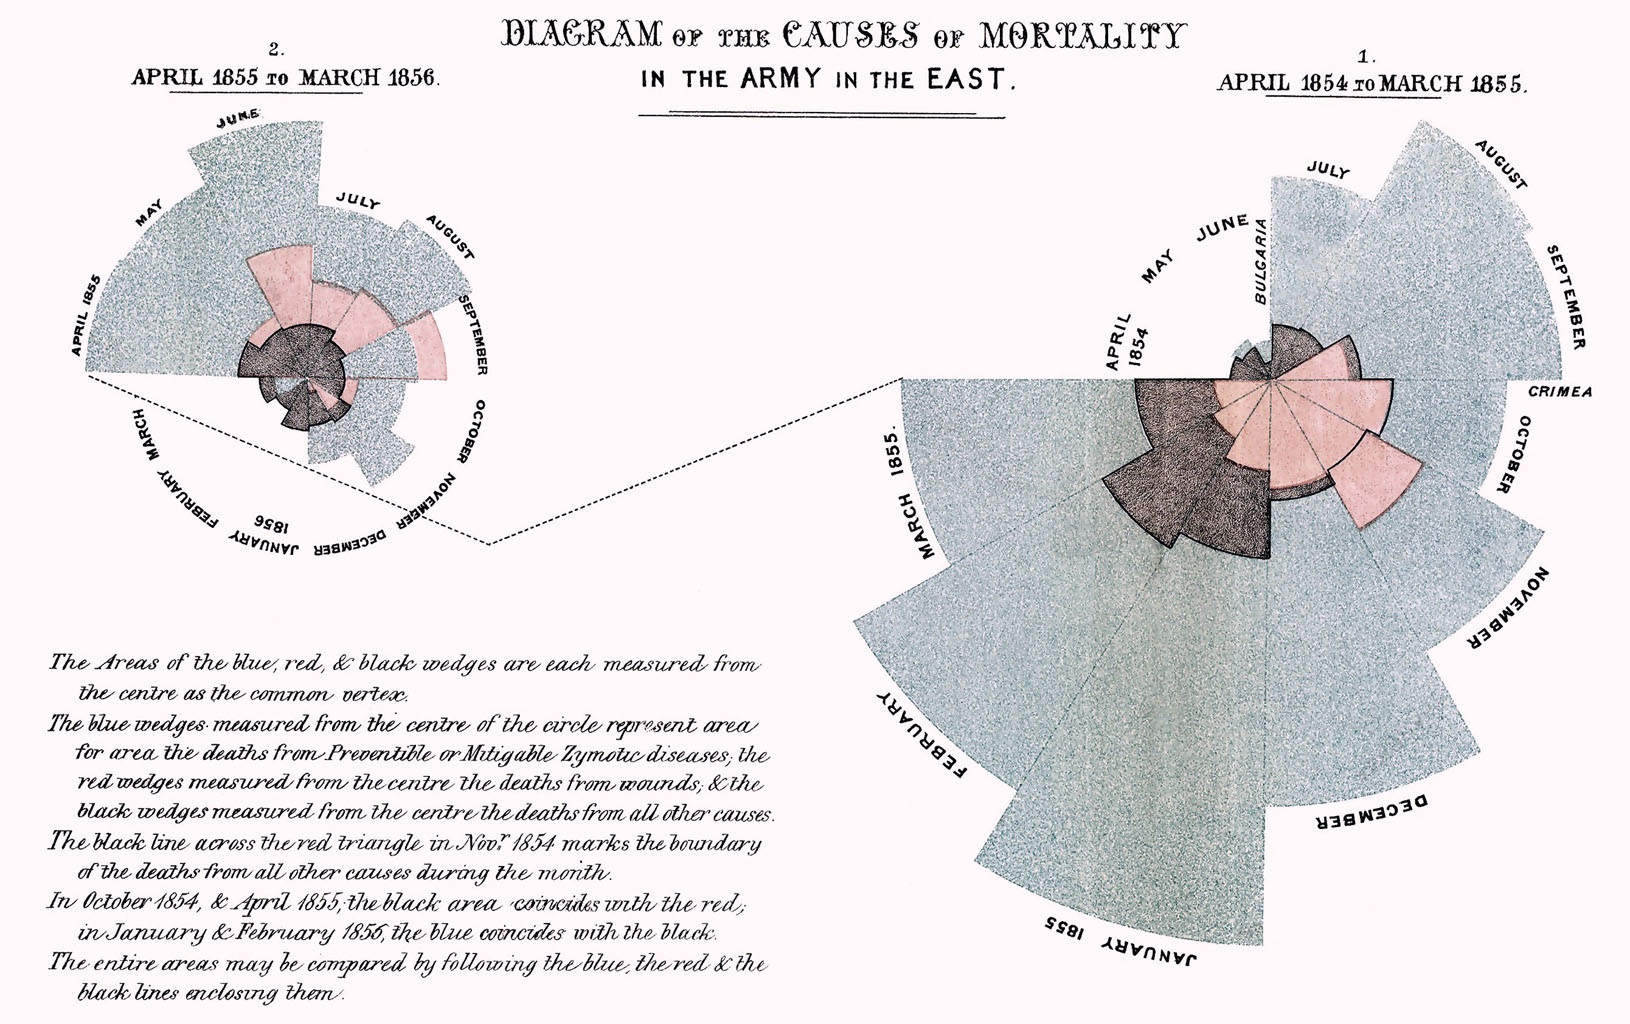
Nightingale challenged a deeply ingrained assumption expressed by Britain’s chief medical officer: that fatalities from infectious diseases were, “practically speaking, unavoidable.” Her innovative rose diagram, with its explosive, outward-radiating design, demolished this claim and demanded greater government action.
Understanding the power of effectively presented data, Nightingale restructured the appendix from her Royal Commission report and privately printed two thousand copies as* Mortality of the British Army* (1858), which she circulated among influential figures she believed could advance her mission. The rose diagram itself first appeared in an 1859 pamphlet that built upon the evidence presented in Mortality.
Consequently, Florence Nightingale saved thousands of lives by turning her research into a clear understandable format so people could make better informed decisions. This story encapsulates the power and impact of information design and inspires what we do at Axamattic.