Process
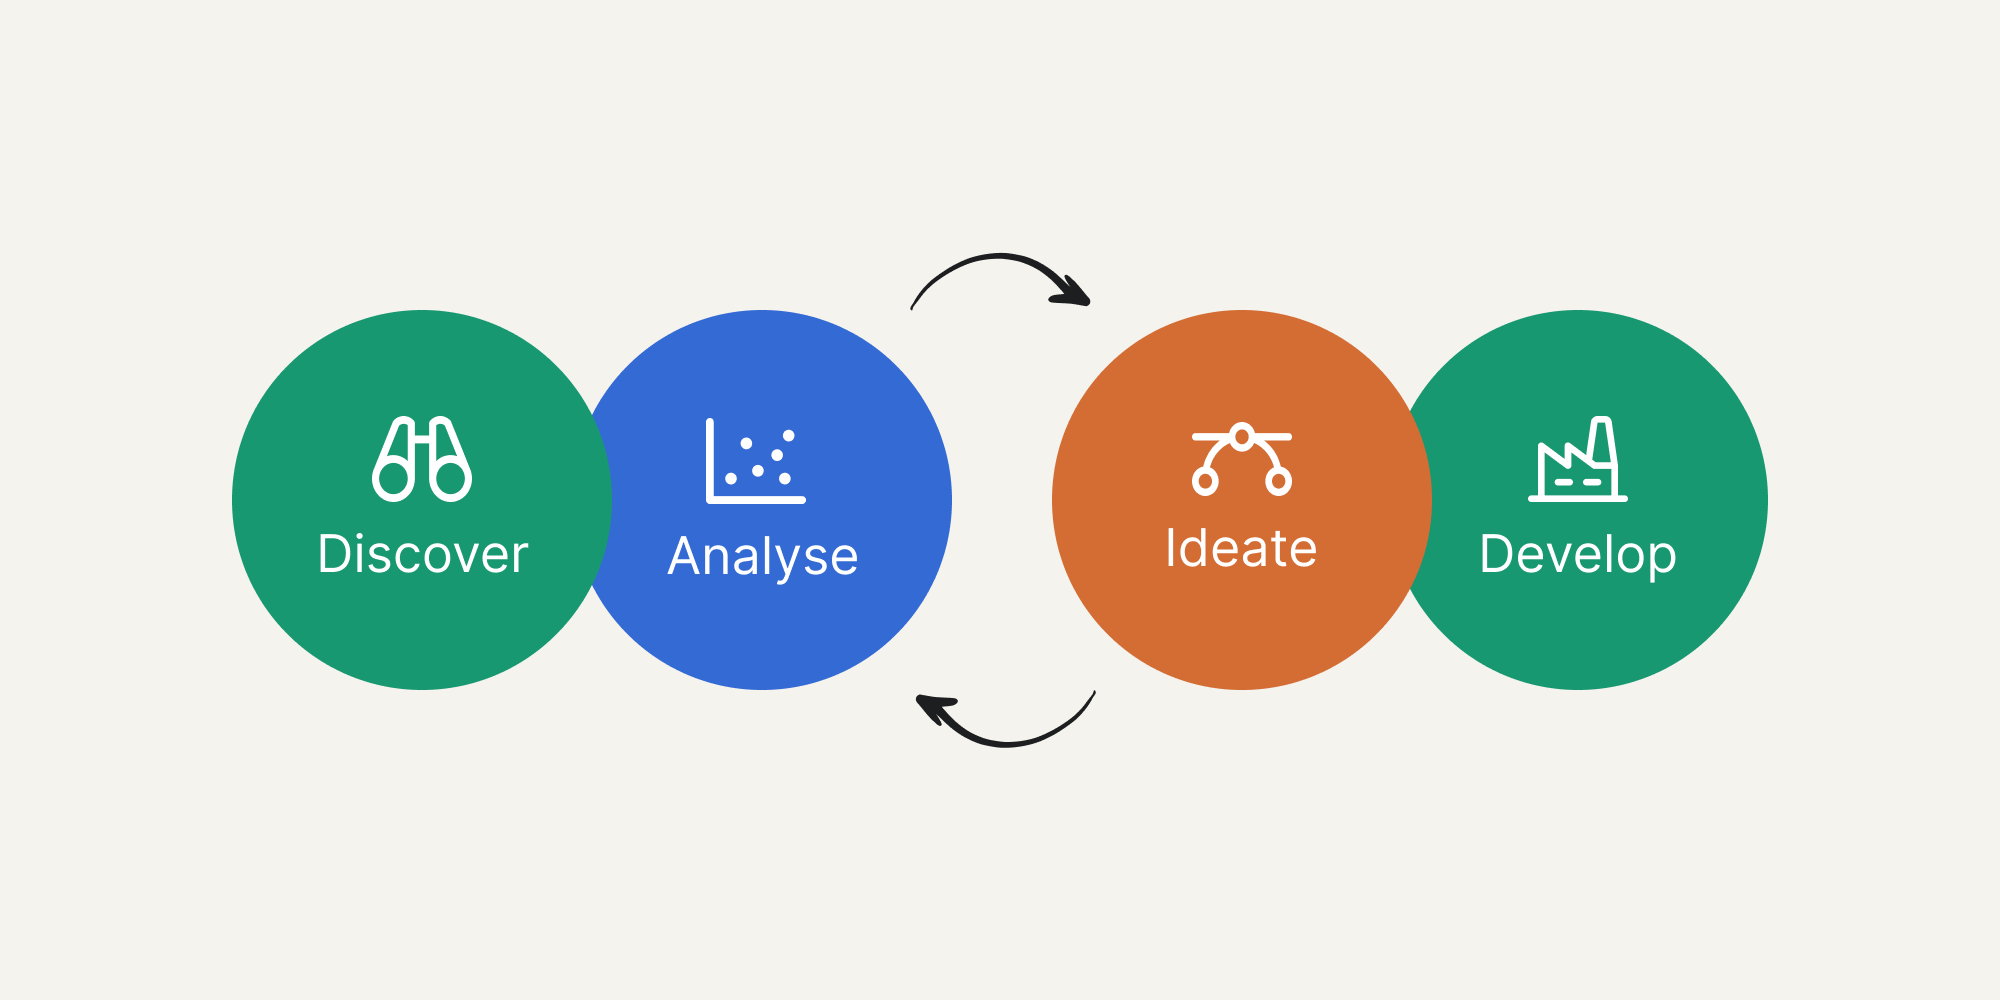
Our data design process takes you from complex data to clear platforms, tools, or narratives that create understanding for your audience. The following section walks through each of the four phases. This is a guide to the general process, providing enough detail to get you started on your own projects.
Each project requires adaptation. Your team’s skills, the project’s goals, and the nature of your data will all influence how you apply these phases. Use this framework as a foundation, but remain flexible in your approach.
Discover
Discover is the first step in the process. It’s about answering key questions and extracting information so everyone is aligned on what you’re aiming to do and why. You do this through various methods such as brainstorming, ideal viewer profiles, desk research, journey mapping and group discussion.
Start with a discovery workshop. Gather all stakeholders, whether in person or remotely, and focus on answering these fundamental questions:
1. What is the aim of the data (or research) we’re working with?
This question serves two purposes. First, understand why the data was collected and what it was meant to achieve. Second, establish the domain context (the topic in question). This is crucial when team members or stakeholders aren’t domain specialists.
2. What is the end goal this project is trying to achieve?
Be intentional and purposeful. This question directly applies the first principle: Purpose First. Align the group on what you want your audience to understand, what behaviour you’re trying to change, and what decision needs to be made.
3. Who is the target audience for this project?
This may seem obvious, but it’s often the hardest question to answer well. Being specific about your audience is critical for impact. Even if you’re designing for a broad group, identify the sub-groups within it: Are they young or old? What are their socio-economic backgrounds, occupations, and education levels? Apply Principle 7: Design for Your Audience’s Context.
4. What does the current target audience know about the topic in question?
Once you’ve identified your audience, understand their current knowledge level. What do they already know? What assumptions do they hold? What misconceptions might they have? Misjudging audience knowledge is a common failure point: assume too much expertise, and you’ll confuse them; assume too little, and you’ll make little impact.
5. What knowledge gaps does the target audience have?
Once you know what your audience understands, identify what they don’t. These gaps determine where you need definitions, context, or additional explanation.
Analyse
Once Discover establishes your objectives and audience, the Analyse phase begins. This is where you gather data, clean it, and explore it to understand what you’re working with. Approach this phase with curiosity, not conclusions, and remember Principle 3: Let Data Reveal the Story.
Get Access to Your Data
Often data is difficult to access or use. You may need to collate multiple sources or handle datasets too large to download directly. For these situations, create an API endpoint that provides programmatic access to your data. If datasets are extremely large, stream them directly to cloud storage (such as AWS S3) using command-line tools. This approach is particularly helpful when data security compliance is required, as it maintains proper protocols while enabling analysis.
Clean and Document Your Data
Once you have access to your data (whether in a Postgres database, S3, or another source), clean it and create a data dictionary. A data dictionary describes the format, content, and structure of your data, making it accessible to others and providing a clear reference throughout the project. This documentation becomes invaluable as your project progresses and new team members join, preventing confusion about variable meanings, units, or data collection methods.
Rapidly Visualise for Exploration
With clean, accessible data, begin rapidly visualising it to understand patterns, correlations, and distributions. Tools like Chart.js, Seaborn, and RawGraphs enable quick exploration. Don’t limit yourself to simple charts—apply advanced analytical techniques such as clustering or correlation analysis to reveal structures and relationships that aren’t immediately obvious in raw data.
Graph your data in multiple ways. Try different chart types, different variable combinations, different groupings. Visualisation reveals what summary statistics cannot, as demonstrated by Anscombe’s Quartet.
The Power of Visualisation: Anscombe’s Quartet
Francis Anscombe, a statistician, created four datasets with nearly identical descriptive statistics (mean, variance, correlation). Yet when visualised, they reveal completely different patterns and distributions. One shows a clear linear relationship. Another reveals a curved pattern. A third contains an outlier that distorts the correlation. The fourth demonstrates how a single extreme value can create a misleading statistical relationship.
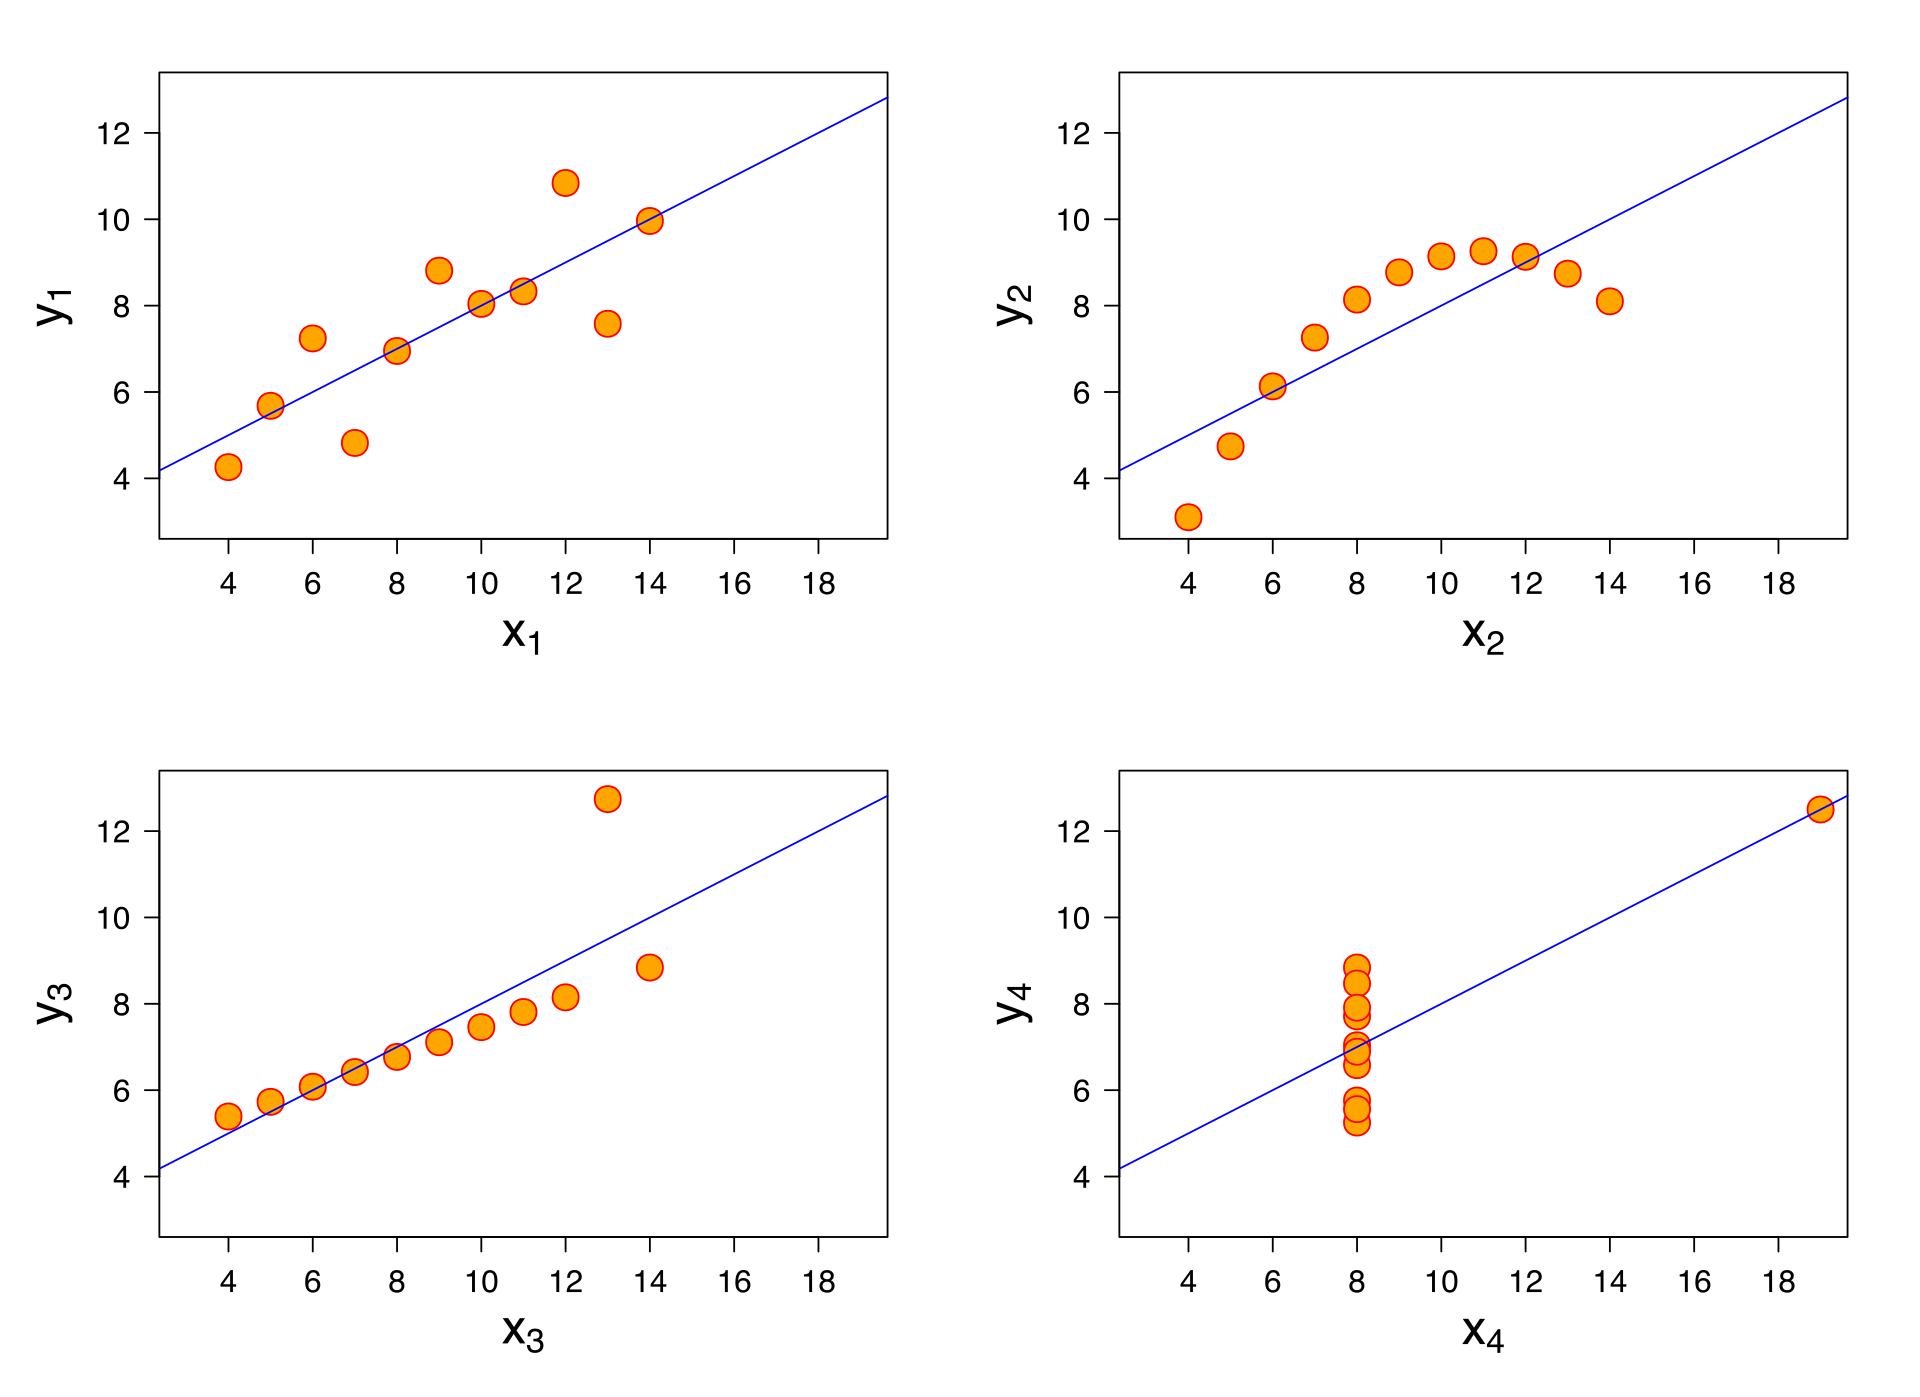 All four sets have identical statistical parameters, but the graphs show them to be considerably different.
This famous example demonstrates why visualisation is essential during analysis. Summary statistics alone can obscure the truth. Only by seeing your data can you understand its true character and identify patterns, outliers, or relationships that require attention.
Ideate
Once you’ve completed the Analyse phase with clean data and exploratory visualisations, you’re ready to ideate solutions. Expect to iterate between Analyse and Ideate several times. Initial ideas often prompt new questions that require further analysis.
Gather Your Foundation Materials
Begin by compiling everything you’ve learned so far: the audience profile from Discover, your problem statement and desired action, the data dictionary, and your exploratory graphs and key findings. Assemble these into a data document that all stakeholders can reference during ideation. This comprehensive brief ensures everyone works from the same understanding of the challenge, audience, and available data.
Run a Collaborative Ideation Workshop
With your materials prepared, bring stakeholders together for collaborative idea generation. Make everything easily accessible—pin materials on the wall or display them in a digital whiteboard tool like Miro. Use structured exercises to generate diverse approaches:
Crazy 8s: for rapid concept generation, participants sketch eight different ideas in eight minutes, forcing quick, instinctive thinking rather than overthinking.
Storyboarding: to map the user journey through your data narrative. How will your audience encounter, explore, and act on the information?
Collaborative sketching: for visual exploration, working together to iterate on concepts and build on each other’s ideas.
These exercises ensure multiple perspectives inform your solution and prevent any single viewpoint from dominating.
Address Creative Discomfort
It is common for participants to feel uncomfortable with creative exercises due to the misconception that you need to be an artist to sketch ideas. Many believe that if they cannot draw well, there is no point in trying. Remedy this by emphasising that sketching is about communicating ideas, not creating masterpieces.
Start the workshop with a drawing-based icebreaker that encourages creativity and lowers inhibitions, such as: “Draw something to hold a bunch of flowers that cannot be a vase.” This simple exercise demonstrates that rough sketches communicate effectively and breaks down the barrier of perfectionism.
Embrace Iteration
Some ideas generated during ideation will require returning to the Analyse phase to verify feasibility or explore the data from a different angle. This iteration is not a setback but a natural part of developing strong solutions. Each cycle between analysis and ideation refines your understanding and strengthens your final approach. Don’t resist moving backward—it’s often the path forward.
Move to Rapid Prototyping
Once you have a few promising ideas, move quickly to rapid prototyping. The purpose is to make your concepts tangible so you can evaluate their viability. Tools like Processing, HTML/CSS/JavaScript, or v0.dev enable quick iteration. Focus on demonstrating functionality and core interactions rather than perfecting the tool choice or visual polish at this stage. A rough, working prototype reveals more than a polished concept that can’t be tested.
Test with Your Target Audience
Which prototypes should you pursue? Test them with people who represent your target audience. Before testing, define your objectives clearly. What do you want to learn? What would constitute success? What assumptions are you trying to validate or disprove?
Return to Discover question 2: “What is the end goal this project is trying to achieve?” Your testing objectives should align directly with this goal. Are users able to understand the data? Does the interaction feel intuitive? Can they identify the insight you’re trying to communicate? Does it prompt them toward the desired action?
For guidance on crafting effective test questions that reveal genuine user behaviour rather than polite feedback, Stephanie Walters’ cheatsheet for user interviews provides an excellent foundation.
Develop
Once you’ve identified a solution worth pursuing through rapid prototyping, you’re ready to build a production version. This phase takes you from concept to a finished interactive tool, platform, or narrative that transforms your complex data into action.
Review Against The Principles
Step back and evaluate your prototype against the 9 Principles for Information Design. Critically analyse what you’ve built: Which principles does it honour? Where does it fall short? Take screenshots and annotate them with specific observations about clarity, accuracy, and impact. This audit ensures your final version builds on a solid foundation rather than amplifying existing flaws.
Refine the Visual Design
Visual aesthetics matter. Effective design combines clarity with appeal, making your insights both understandable and compelling. Invest time exploring visual directions by gathering inspiration from diverse sources: data journalism, interactive documentaries, compelling data narratives, or installations that bring data to life. Capture what resonates and build a reference library.
As you refine the design, keep your audience central. Repeatedly ask: “Will this make my target audience understand and act?” Every design choice—from colour palette to typography to interaction patterns—should serve this goal. Interactive tools and platforms demand careful attention to how users navigate, explore, and extract meaning from your data.
Design with Components
Interactive platforms are built from modular, reusable components. Think of these as the building blocks of your interface. For example, a search component includes the input field itself plus multiple states: default (ready for input), active (showing results as users type), empty (no results found), and error states. A data filter component might include a dropdown, sliders, and toggle switches that all work together.
You can design these components visually using tools like Figma or Sketch, which allow rapid iteration and style exploration. These designs become the blueprint that developers use to build the actual interactive components. Clear, well-documented component designs ensure your vision translates accurately into the final platform.
Working with Development Partners
Building interactive platforms and tools requires technical expertise. Whether you’re working with an in-house team or partnering with a consultancy like Axamattic, effective collaboration is essential.
Communicate Your Requirements Clearly
Provide your annotated prototypes, reference your Discover phase objectives, and be explicit about what success looks like. Developers need to understand not just what to build, but why it matters, who will use it, and what actions it should enable.
Establish the Technical Approach Together
Your development partners will select technologies and frameworks based on your project’s specific needs; the type of interactions required, data volume, security requirements, and where users will access the platform (web, mobile, or both). They should explain their technical recommendations in clear terms and how these choices serve your goals.
Leverage Your Data Foundation
The API and data infrastructure created during the Analyse phase provides the foundation for your platform. However, additional backend processing will likely be needed for real-time data updates, search functionality, filtering, or complex calculations. Work with developers to identify these requirements early and ensure your data architecture supports the interactive features your audience needs.
Plan for Deployment and Hosting
Interactive platforms require reliable hosting infrastructure. For web-based tools and platforms, cloud services provide the security, scalability, and performance necessary for professional deployment. Discuss hosting requirements, security protocols, access controls, and long-term maintenance with your development team and IT stakeholders.
Prepare for Launch
Before release, ensure you have:
- A plan for gathering feedback from early users
- A process for addressing technical issues or user questions
- Metrics to measure whether your platform achieves its intended impact
- A maintenance plan for updates, bug fixes, and potential enhancements
The end of Develop marks the beginning of your platform creating real-world impact.
Conclusion
You now have a framework for transforming complex data into platforms, tools, and narratives that drive action. The four phases, Discover, Analyse, Ideate, and Develop, provide structure for what can otherwise feel like an overwhelming challenge. But remember: this is a guide, not a formula. Every project will require you to adapt this process to your specific context, constraints, and goals.
The most important principle underlying this entire process is one you encountered at the beginning: understanding precedes action. Every phase of this framework serves that principle. Discover ensures you understand your audience and objectives. Analyse helps you understand your data’s true character. Ideate translates understanding into tangible solutions. Develop refines those solutions into tools that create understanding for others.
The people who create the most impactful work iterate relentlessly. They test, learn, revise, and test again. They return to earlier phases when new insights emerge. They remain curious about their data and humble about their assumptions. This flexibility and willingness to learn is what separates adequate information design from transformative work.